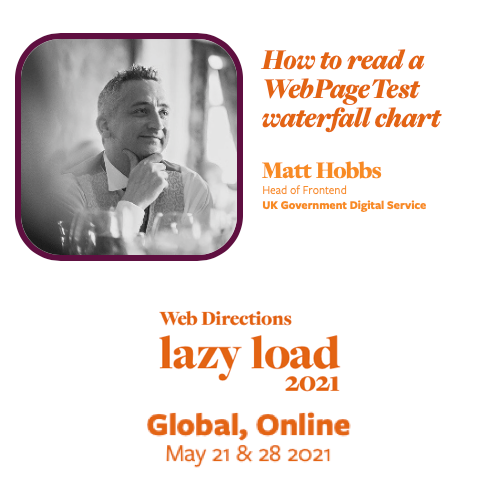
Web Directions Lazy Load ’21 session spotlight–How to read a WebPageTest waterfall chart
How to read a WebPageTest waterfall chart
Matt Hobbs, Head of Frontend UK Government Digital Service
WebPageTest is one of the most well known and important tools in the web performance community. It’s been actively developed by Pat Meenan since he worked at AOL in 2008. It has become the go to tool for both very simple to very advanced debugging of the web performance of a website. One of its most well known charts is the waterfall chart.
In this talk I’m going to introduce the waterfall chart and also go into detail on how you can examine and read it. The more you understand about the chart, the the more WebPageTest as a whole will be able to help you fix a slow performing website.
About Matt Hobbs
Matt Hobbs is Head of Frontend Development at the UK Government Digital Service. An experienced frontend developer, he is passionate about using his skills to build accessible and performant user interfaces.
Matt makes a point of keeping on top of the latest technology and tools, is interested in all aspects of interface development, and is a keen advocate for best practices.

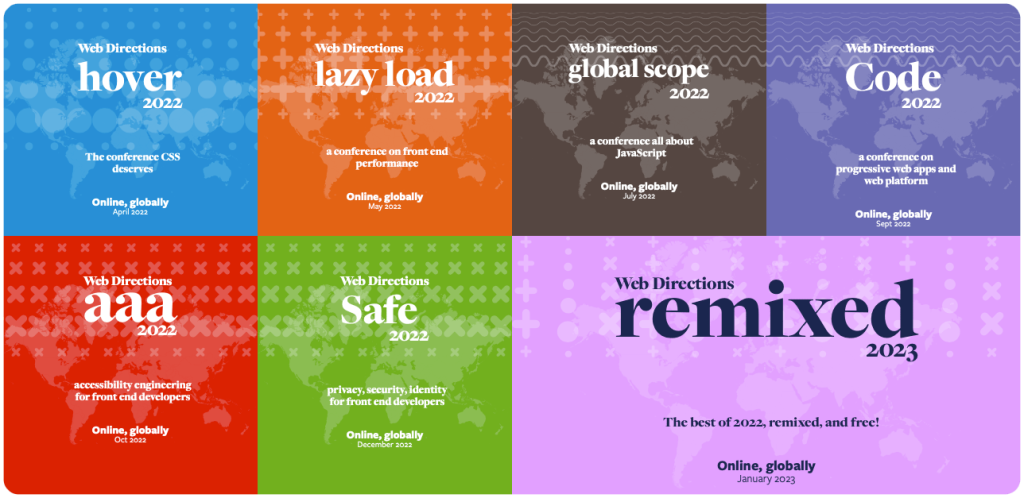
In 2022 we have a whole series of events for Front End Developers
Across 2022 Web Directions is presenting our series of online conferences for front end designers and developers. Focussed deep dives, they go far beyond what you might expect from conference programs.
Priced individually from $195, or attend all 6, plus get access to our conference presentation platform Conffab for just $595, or $59 a month.
Great reading, every weekend.
We round up the best writing about the web and send it your way each Friday.

